Choose a function
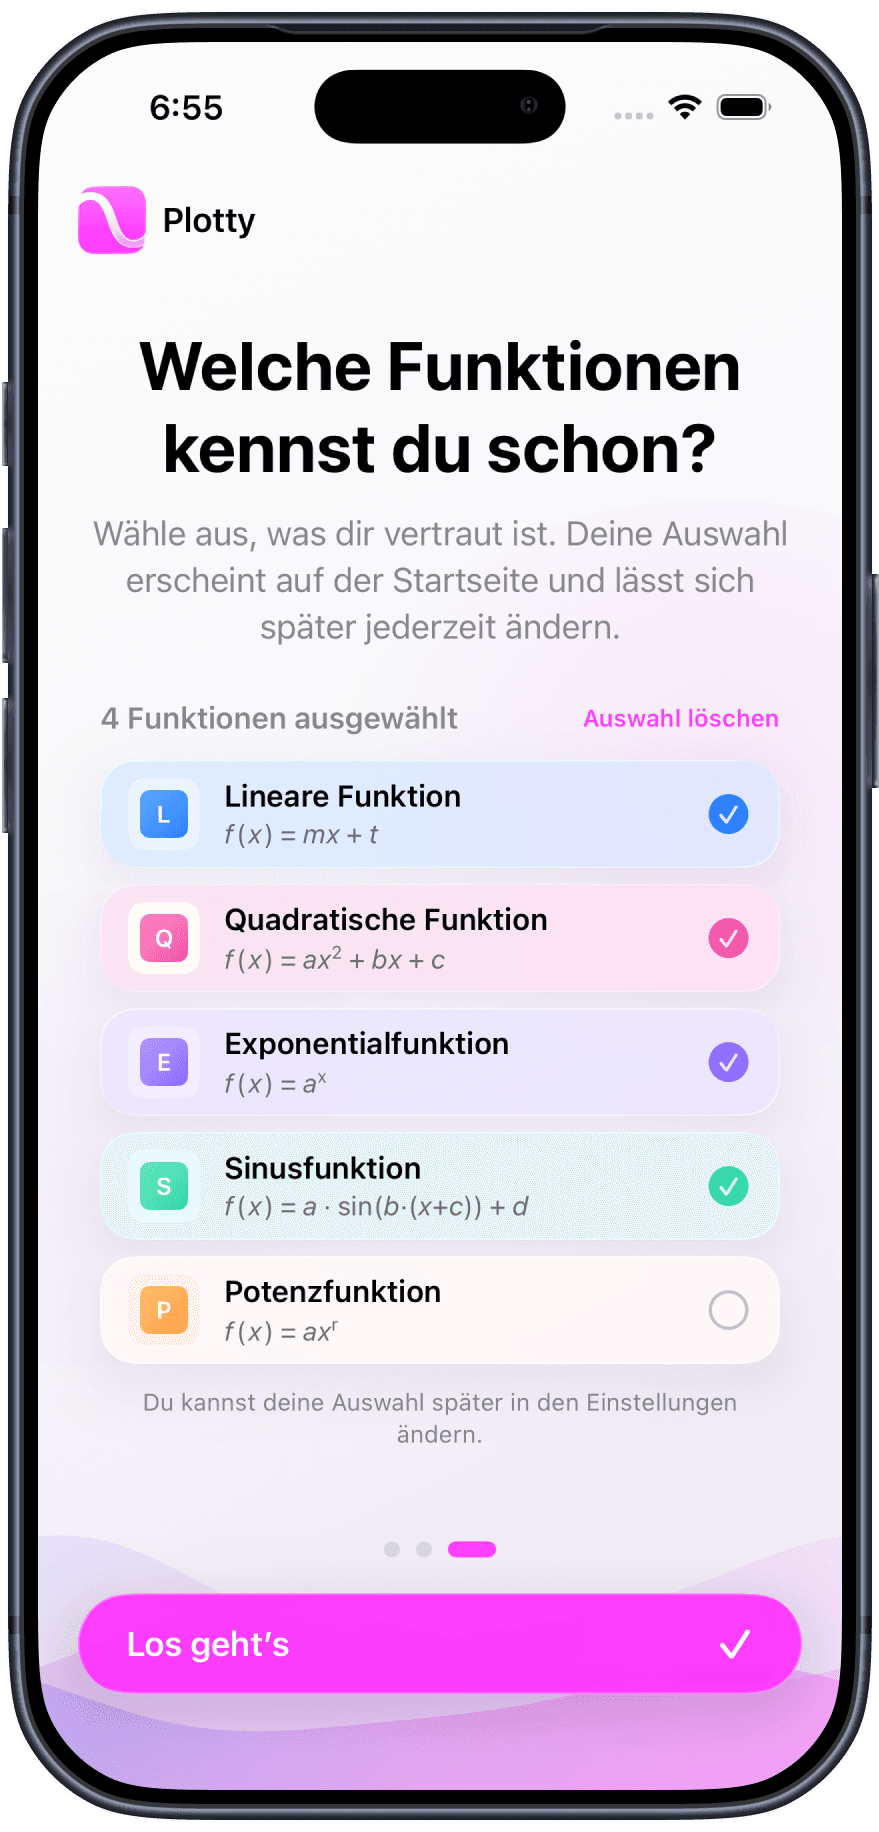
Start with a familiar function family or enter an expression of your own.
A visual math app for students
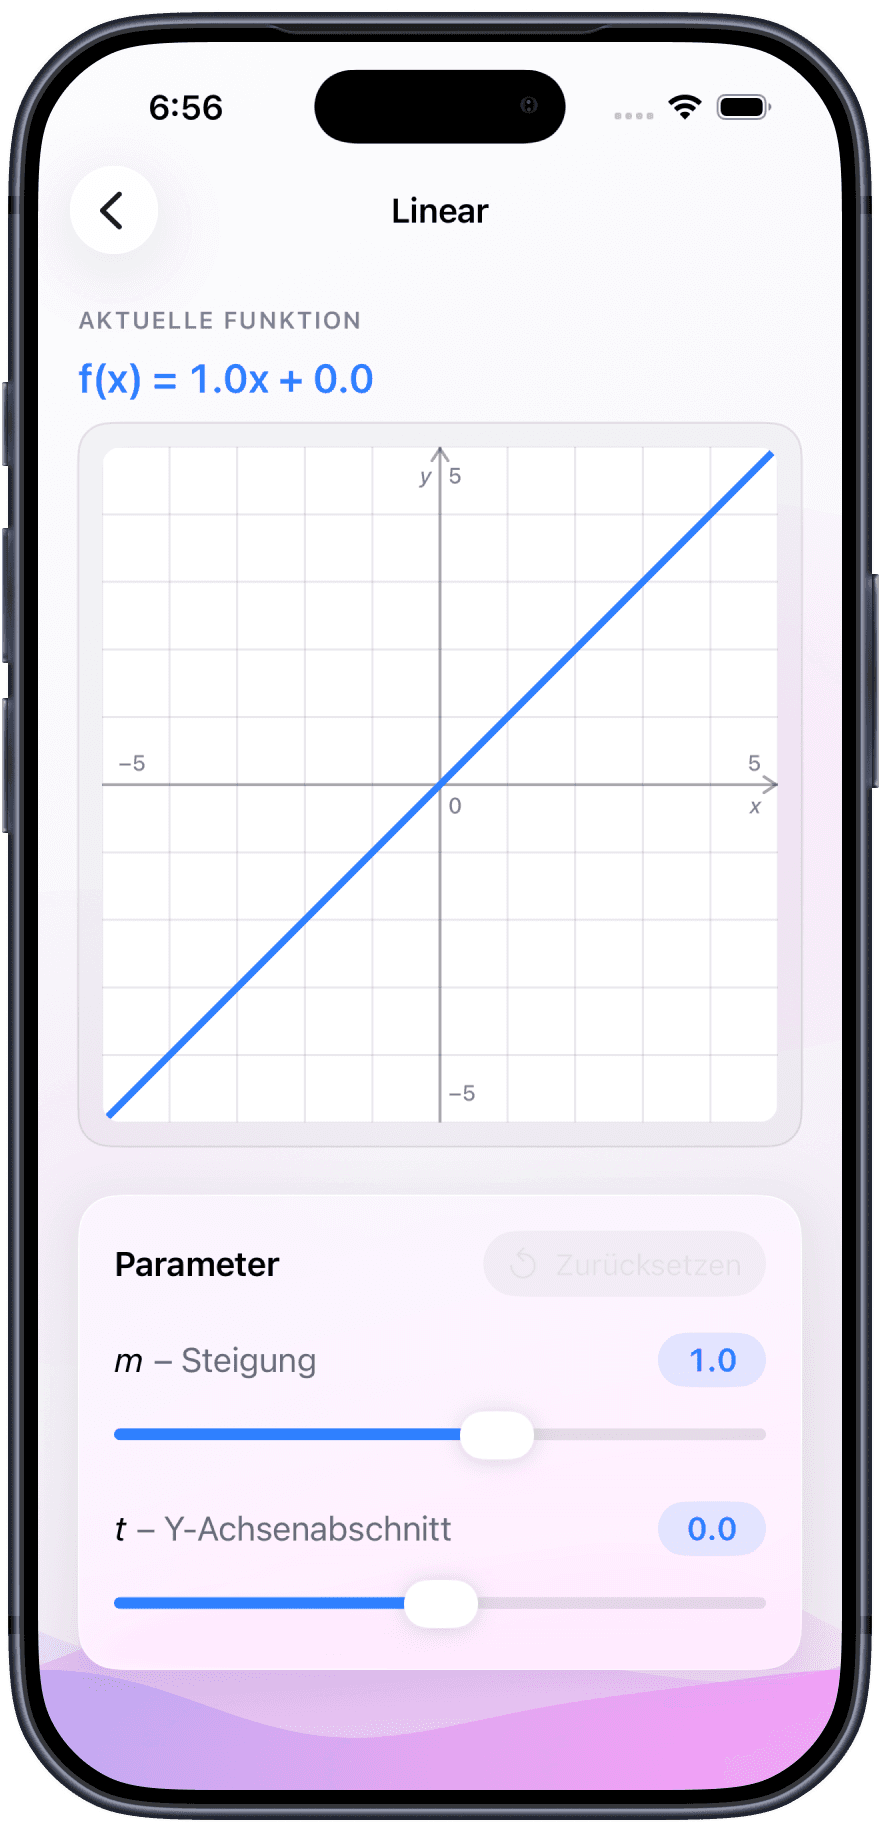
Connect formulas to their graphs, adjust parameters, and see immediately how each change shapes the curve.
How it works
Start with a familiar function family or enter an expression of your own.
Use clear, labeled controls and watch the graph respond in real time.
See how every change in the formula affects the curve and its important points.
Built to go deeper
Once a curve makes sense, Plotty stays out of the way and lets you take it further.
Type a term with x — parentheses, sine, cosine, and powers included — and watch it appear while you type.
Roots, the y-intercept, vertices, and extrema can be marked with their coordinates. Show only the ones you need.
Change a parameter and the unchanged function stays behind it as a dashed curve, so every edit becomes a comparison.
Send a link that reopens the exact configuration in Plotty, or export the graph as a PNG. The link contains the function and its parameter values—no account required.
Save a configuration as a favorite and come back to it later. Favorites stay on your device.
Hide function types you are not working on, and turn axis labels or grid lines off when you want a simpler, less distracting graph.
Start with the essentials
From a straight line to a sine wave, Plotty makes each curve easy to explore.
f(x) = mx + t
Relationships, slopes, and intercepts.
f(x) = ax² + bx + c
Parabolas, roots, and turning points.
f(x) = aˣ
Growth and decay made intuitive.
f(x) = a sin(b(x + c)) + d
Understand periodic motion through movement.
f(x) = axʳ
Explore exponents and scaling.
For parents
Plotty helps students explore functions at their own pace. It is a visual learning companion for building intuition—not a shortcut that simply gives away answers.
Students get immediate visual feedback as they change a parameter, helping them connect an abstract formula to the graph it creates.
Plotty has no accounts, advertising, or analytics. Settings and favorites stay on the student’s device.
There is no feed, social layer, or complicated setup—just clear controls and the mathematics students are exploring.
Ready to explore?
Download Plotty for free and discover how much easier functions become when every change is visible.